Stop estimating your Moderne ROI, and start measuring it
Contents
Moderne has had a real, measurable impact everywhere it’s been put to work seriously. SAP took a migration that would have cost 60 employee-months and did it in 17. A Fortune 50 retailer moved more than 3,500 repositories to Spring Boot 3.x and 4,000 more onto Java 17, modernizing 20 million lines of code without weeks of manual coordination across teams. Morgan Stanley has talked publicly about running Moderne at a scale most platforms never see, and taking seriously the question of what they’re actually getting back from it.
The proof exists because someone sat down and pulled the numbers together to share. But it should be easy for every Moderne customer that’s generating this same kind of impact to see it themselves and share it with their teams. That’s what telemetry is for.
Going beyond “trust me, it’s working”
The people who get the most out of Moderne, like the engineer running it day to day and pointing a coding agent at it, or the director who fought to bring it in, see the results firsthand: repos cleaned up, upgrades that used to take a quarter done in weeks, security fixes applied before anyone has to think about them. What’s hard is getting the leader above them to see it too, and that next person usually has the same problem with whoever is above them. “Trust me, this is working” doesn’t travel well up a management chain. Leadership wants to see the progress in a form they can check against everything else they already track.
What that means varies depending on the team. Some organizations already have a mature data practice that they trust. They just want raw, well-structured access so they can plug the Moderne telemetry data into their existing management reports and dashboards. Others may not have anyone dedicated to building data pipelines, so they are looking for something that works out of the box, even if it’s not fully custom.
Moderne telemetry is built with both in mind, but both kinds of teams run into the same question once they actually sit down to build that report: what’s actually worth measuring, and what does each number prove?
What to measure, and why it matters
Here’s what our customer success team looks at when they sit down with a customer to build that case. These are categories that we see show up frequently, because they map directly to the outcomes leadership actually cares about:
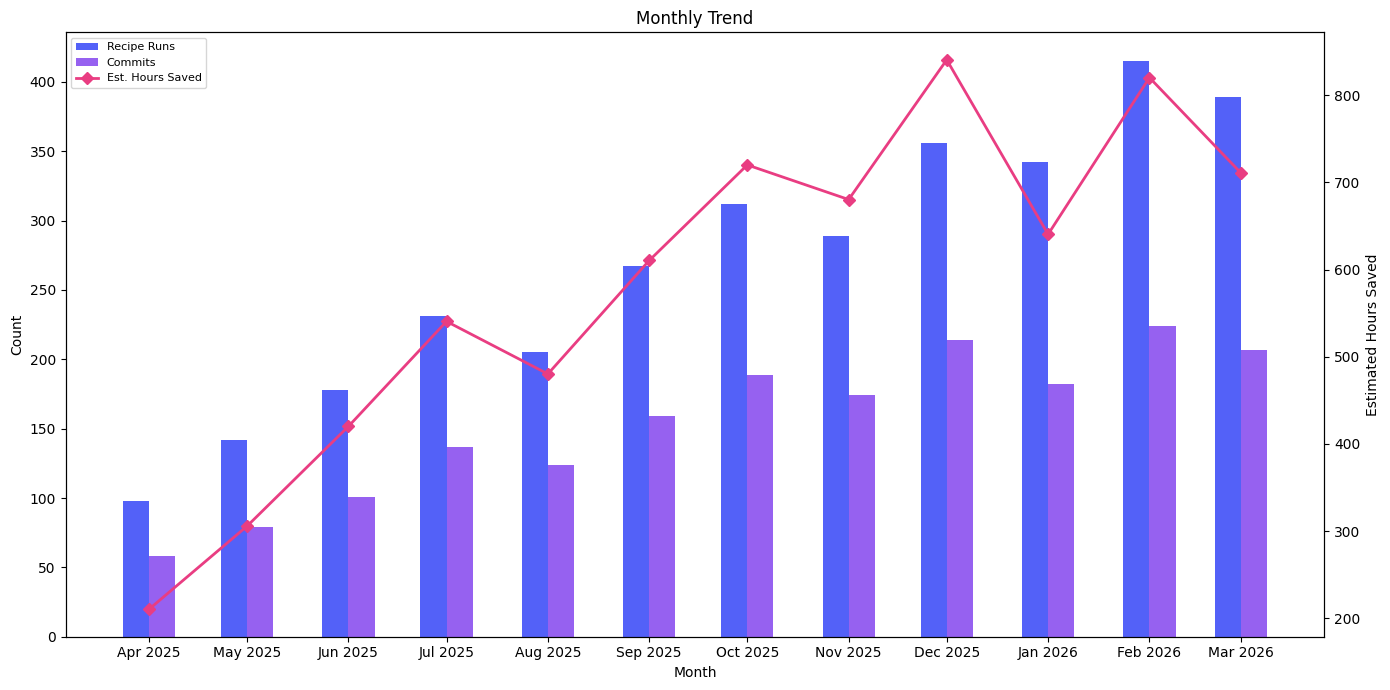
The first level of the ROI story. Every recipe run records an estimated time savings in its trace and when rolled up with total commits landed, you get a simple case of $X saved against $Y in spend. It’s real and worth reporting, but it’s also a cost metric: what you avoided, not what you gained, so treat it as the opening line of the story rather than the whole thing. Still, this is a good leading indicator for what’s to come so you can earn more time and resources to get to the outcomes you’re aiming for.
The business value that follows. Consider what being current does for the organization. Developers spend less time working around deprecated APIs and outdated patterns, and more time on work the business asked for. Security and compliance teams stop nagging about known vulnerabilities in frameworks everyone meant to upgrade eventually.
To this end, it’s important to track outcomes, not just commits. Our guide to measuring migration progress explains why PR counts are a weak proxy for actual progress, since a merged PR doesn’t guarantee that the change stuck.
The best version of this goes beyond “did we migrate the code.” One insurance customer’s Spring Boot migration is a good example. Automating the migration didn’t just close out the maintenance backlog, it freed up capacity the team redirected into business-focused work, a 30% increase in business-focused stories completed the same quarter. This is the gold standard.
Adoption, not just usage. Active developers and recipes run show activity, but the more useful signal is the shape of it. Which recipes are resulting in the most commits? A recipe already driving real value for one team is worth broadcasting to the rest of the org as a strong candidate to help others too. Which recipes see a lot of dry runs but few commits? Something is stopping developers at the last step, and it’s worth investigating. Recipe breadth is its own signal. A growing count of distinct recipes in use, especially ones a team built themselves, means developers are finding new problems to point Moderne at.
As more developers work through coding agents, local MCP usage and agent chat sessions show up in the trace data alongside everything else, tagged with the agent that ran them, so you can see whether agent-driven usage is growing and which agents your developers are reaching for.
Product health as an early-warning system. Track build success rate, commit failure rate, and latency trends so that you catch a problem before it turns into a support ticket, or worse, a reason not to trust the platform. Adoption depends on the platform being reliable enough that developers and their agents reach for it without thinking twice, having what they need and behaving the way they expect every time. A recipe that fails silently may not just cost that one run, it may mean that developer considers reaching for another tool, or worse, skips making the change at all.
A breakdown that matches how your organization actually thinks about itself. The aggregate number is good for an executive summary, but different people trust different slices of it. A business unit VP wants to see their own numbers, not a company-wide rollup. An engineering lead wants recipe and language usage for the stack their team owns. Break results out by campaign too, so the result of a specific initiative (a Java upgrade, a CVE remediation push) can be pointed to on its own. Do the same for how the work got done (SaaS, CLI, headless automation, or coding agents), so you can see the interface driving the most value. The more people who can find their own team in the data, the more the top-line number gets believed.
Inside Moderne’s telemetry pipeline
Telemetry data ends up in storage you own, structured so it’s ready for whatever query engine you already use.
Every command produces a trace, whether it’s a recipe run, LST build, git sync, apply, commit, push, local MCP call or agent chat session. It doesn’t matter if the command happened through the CLI or the SaaS UI, each trace carries some common command metadata:
- Timings and outcomes for the command that ran
- Tool versions and repository identifiers
- The identity of whoever ran it
Each command type also tacks on its own specifics. A build trace records things like source file count and parse errors while a run trace tracks the recipe ID and estimated time savings. It doesn’t capture anything about your code itself of course: no source code, recipe output, or LST contents.
Traces land as raw CSV files in S3 or an Azure blob container using Hive-style partitioning, a format that most BI and data warehouse tools already know how to handle. Using a standard practice like this allows you to plug the data into whatever tooling you’re already using.
Though you can query the raw CSV directly, this isn’t always suitable for ongoing reporting. We recommend converting the trace data into a columnar format (like Parquet or Delta) first. Your team may already have a data practice with its own tooling of choice to manage this, but we’ve also started publishing a reference pipeline for organizations that are looking for more guidance on this solution. Today, that reference implementation runs on AWS Athena, with more engines on the way.
On top of that, the repo also includes a set of starter reports covering the outcomes above using example queries that are ready to run against real or sample data. QuickSight is our own reference implementation for visualizing them, but the same queries port over just as easily to Tableau, Power BI, or whatever your team already uses. This is built in the spirit of the medallion architecture, with the raw CSV as the bronze layer, the typed table compaction as silver, and the reports and dashboards on top of that as the gold layer.
Delivery adapts to the environment too. For SaaS customers, the CLI queues traces locally and pushes them to Moderne’s own bucket. From there we replicate that data into a bucket or storage account you own. But if your environment can’t accept inbound replication, there is a pull-based alternative instead. Moderne DX deployments are air-gapped so they skip Moderne’s bucket entirely. You configure the CLI wrapper to publish traces straight to a destination you control.
With this data architecture, you’ve got the flexibility to point it at a notebook for a quick look, or wire it all the way into an executive dashboard. It’s all based on the same underlying data, but you decide how far to take it.
From data to a story leadership believes
The numbers are table stakes. Turning them into a story leadership will act on is the harder half, and it’s usually where this goes wrong even for teams tracking all the right things. The trick is to use this information proactively. Our customer success team doesn’t wait for a renewal conversation to look at this data. We review it regularly with the platform owners and stakeholders we work with, and when a number moves (like a drop in engaged developers or a recipe with an unusually high dry-run-to-commit ratio) we raise it before it becomes a hard question you have to answer without warning.
Another important part of the story is being able to translate hours saved into dollars in a way that leadership trusts. Moderne’s estimate is deliberately conservative, calculated to stay accurate across very different codebases and teams rather than reflecting the best case for any one of them. Because it’s available from the first recipe run, it’s also a good number for a champion to use when making the case for more investment before the complete and realized results are in. That’s a fine place to start, but almost every organization we work with eventually adjusts it to reflect its own reality. The customers who build the most convincing case bring their own math to the table.
One customer built a formula on top of what Moderne reports by adding credit for the developer prep work of getting each repo ready, adding time for reviewing and applying every file that changed, and adding the time it would have taken to search through the codebase to find what needed to change in the first place.
Others skip the formula and go straight to their own history. One team used its own past modernization efforts as the benchmark, roughly 50 hours per repository for a Java upgrade based on work they’d previously tracked. Across the roughly 1,700 repositories touched, their own math worked out to about $7 million saved, a powerful and believable ROI story precisely because they built the number themselves.
The customers who get the most out of this treat the data the way a product manager treats usage analytics, a feedback loop for deciding where to invest attention. They lean into what’s converting, and they dig into what isn’t. When value is concentrated in one team’s champion, that’s often the clearest place to find your next success story.
Running Moderne well takes the same continued attention as any platform you’re accountable for, revisiting it, tuning it, and broadcasting its true value year over year. The data is what makes that possible.